Introduction
Survey123 is an ESRI app that helps researchers gather
survey-based field data. An online ESRI tutorial was completed to provide an
introduction to this software. The goal of the tutorial was to use data
collection and the 9 Fix-it safety checks to help a homeowner association (HOA)
develop tools to support community disaster preparedness for earthquakes and
home fires. Through the tutorial the class learned about Survey123 and its applications.
Methods
The first step of the tutorial was to create a survey using
Survey123. On the Survey123 website, a new survey was created with the
following information (figure 1):
- Name: HOA Emergency Preparedness Survey
- Tags: HOA, emergency preparedness
- Summary: This survey is being conducted by the HOA to help assess the community’s emergency preparedness in the event of a disaster, such as an earthquake.
 |
| Figure 1. Details of a new survey created in Survey123. |
The survey can be tailored to the researcher’s needs. In the
design tab, there are four options available (figure 2):
Add: select questions types to add
Edit: edit the content and properties of survey questions
Appearance: define appearance of the survey
Settings: add a thank you message
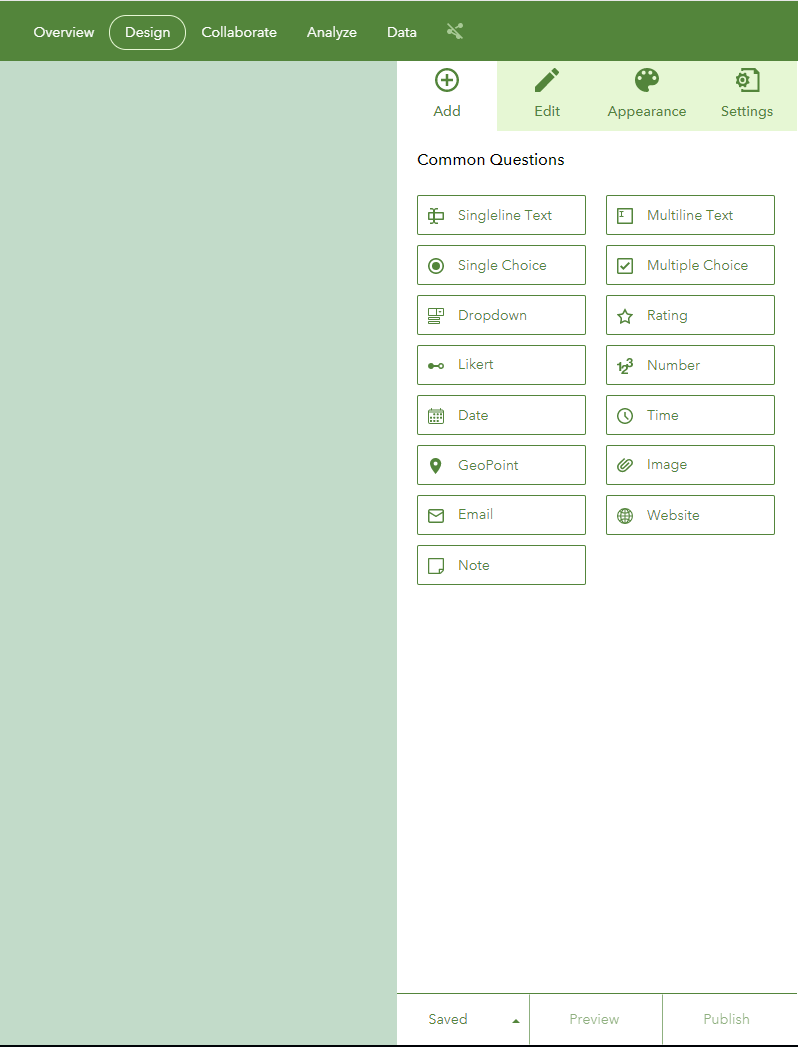 |
| Figure 2. Design tab in Survey123. |
For this tutorial, the survey consisted of three
sections: general participant information, the 9 Fix-it prevention safety checks,
and emergency asset inventory. Questions were added on the add tab mentioned in
figure 2 and adjustments were made in the edit tab as necessary. In figure 3,
the first question added was configured as a date question with the label
“Survey Completion Date,” a default value of submitting date, and the question was denoted as required.
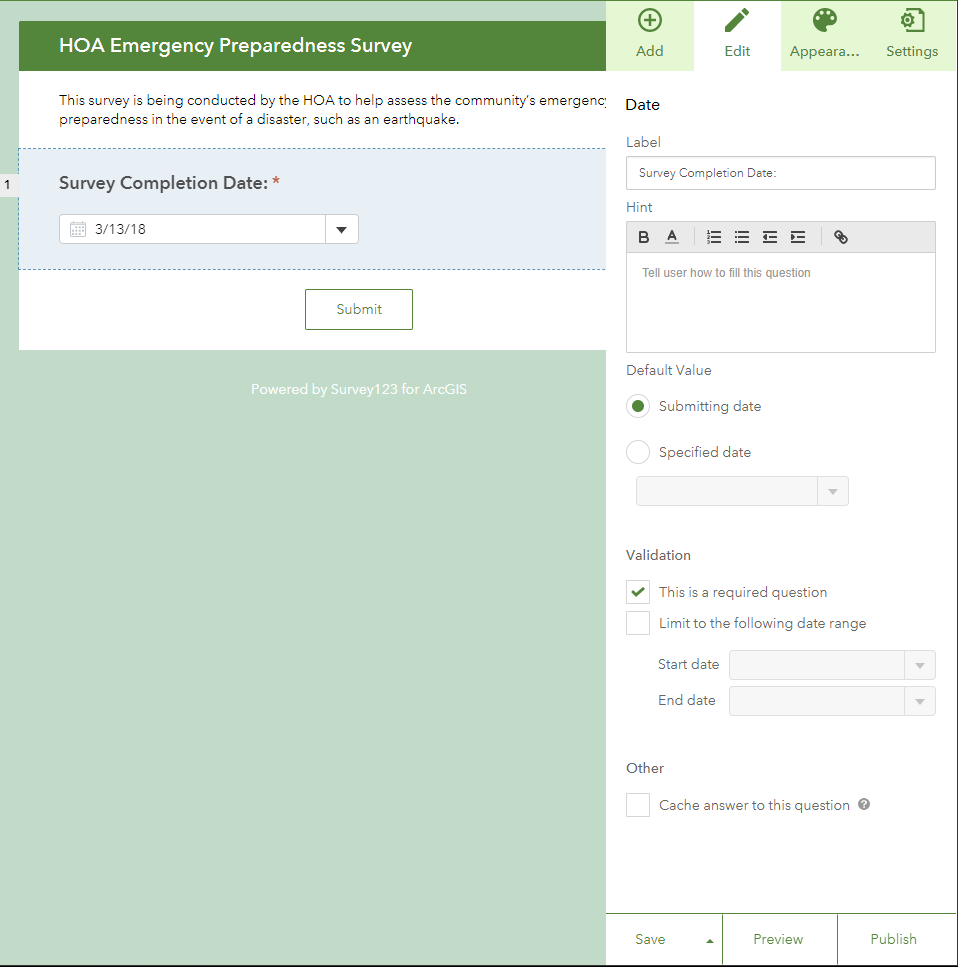 |
| Figure 3. Question 1 configured as a date question. The specifics of the question were added in the column on the right. |
A hint can also be included with questions. There were
several types of questions added to this survey including singleline text,
date, geopoint, single choice, number, and image. Survey123 also has smart form
capability. The survey will only show certain questions based on the answers to
previous questions. In this case, question six was only shown if a specific
answer was given in question 5. This was accomplished by defining a rule in
question five to display question six based on one of the options for question
five (figure 4).
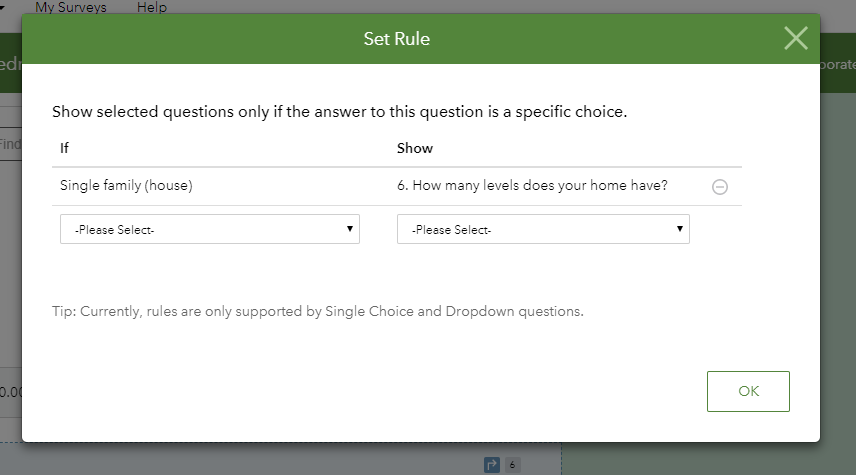 |
| Figure 4. Setting up a rule in Survey123. |
Dropdown questions were also added. These types of questions
provide answer choices in the form of a drop-down list in the survey. This type
of question uses minimal space and can be beneficial for phone users. In total,
29 questions were created using the various types listed above.
The next step was to share the survey (figure 5). In the collaborate
tab the survey was shared to “members of my organization (UW-Eau Claire –
Geography and Anthropology).
 |
| Figure 5. Sharing the survey with UW-Eau Claire - Geography and Anthropology. |
Next, the survey was completed eight times: six times on a
web browser and twice on a phone using the Survey123 field app to provide data
for analysis. The Survey123 field app allows people who work in the field to
download and complete surveys with and without service (figure 6). This provided a large
enough sample to conduct basic analyses.
 |
| Figure 6. Survey123 mobile app. |
Within Survey123 the data collected from the surveys can be
analyzed as a group or individually. Group statistics are visualized in a
variety of ways including maps, bar charts, and pie charts. Individually, the
data responses can be reviewed and connected to the location the survey was
completed (figure 7). The results of the surveys can also be exported as a
shapefile for use in ArcMap.
 |
| Figure 7. Individual analysis of each survey and its results. |
The final step was to share the data with others. To do
this, a map and a web app were created. First, the information associated with
each survey on the map was censored so no personal information showed in the
pop-up. Next, the map was shared with UW-Eau Claire Geography and Anthropology
and saved in my personal content. Then, the basic viewer web app template was
selected and the web app was created. Several settings such as pop-up information
and theme colors were changed, but the overall format stayed consistent with
the template.
Results and Discussion
The final product was a web app that shows the locations of
the surveys and their information in a pop-up window (figure 8 and 9).
 |
| Figure 8. Web app created using Survey123 and ArcGIS Online. |
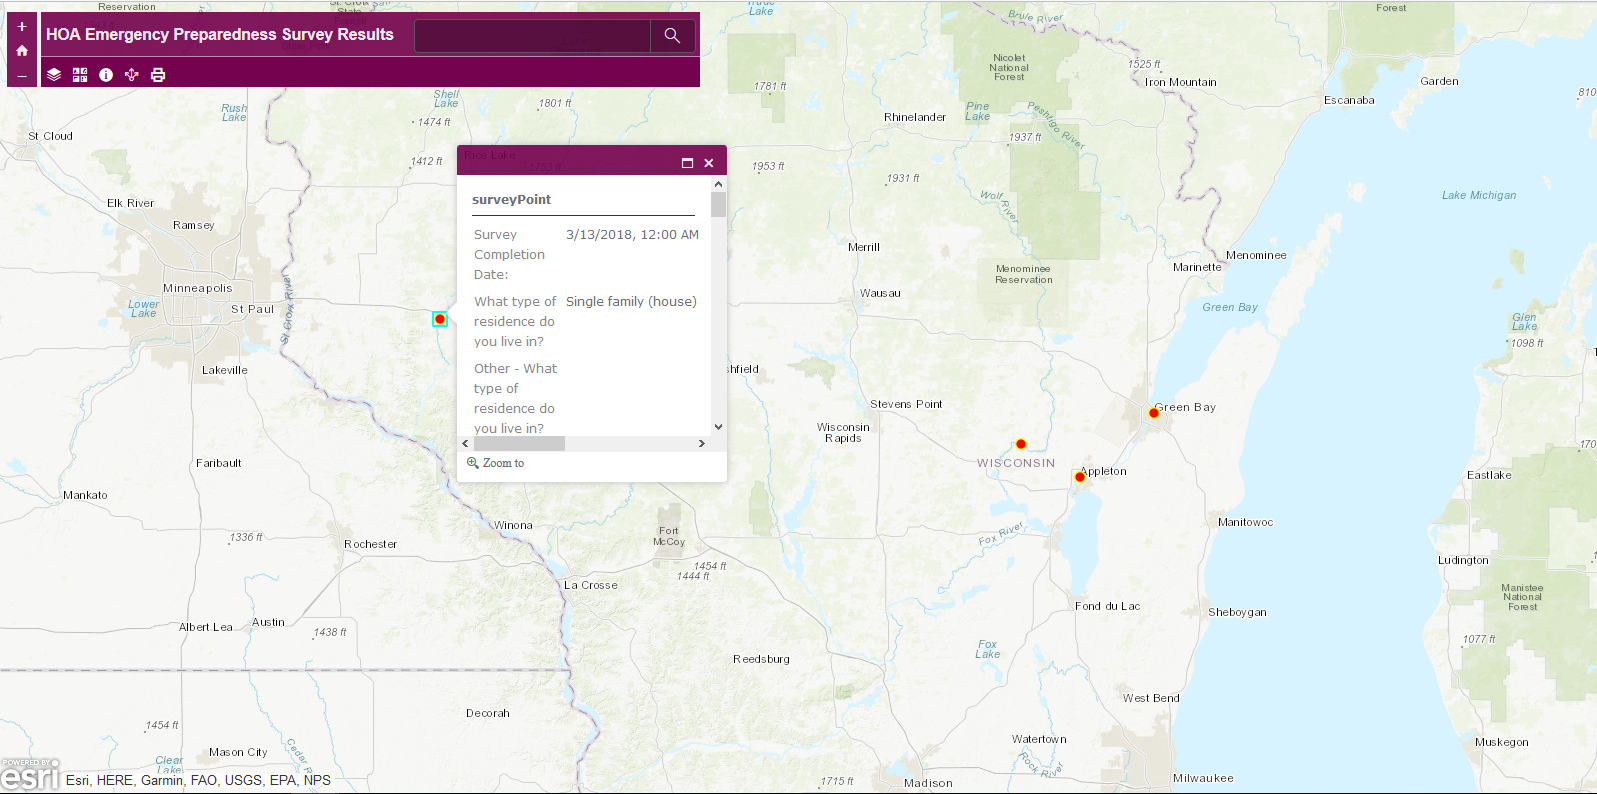 |
| Figure 9. Web app with pop-up window associated with one of the survey points. |
All the surveys were taken by me because the goal of the lab
was to understand how to work with data in Survey123. This means that analyses
of the data are limited. However, the data was still useful for understanding
the Survey123 software. The analyze tab shows column, bar, and pie charts of
each question in the survey. This allows the user to quickly check the
statistics of each question in the survey. The results are also updated as more
surveys are completed. In the Data tab, the survey points are shown in a map
with the surveys listed beneath with the answers to all the questions. The user
can select a certain survey by clicking on the survey point on the map or by
clicking the survey in the table below. From the data tab one can also open map
viewer and edit the map. Survey123 has powerful applications
for researchers including the ability to calculate statistics on survey data
and easily convert the results into a web app.
Conclusion
Survey123 would be helpful in a variety of research
projects. For my current research project, I am analyzing tree core samples
from Brush Island on the Chippewa River. Another researcher or I could use Survey123 to record
information about each tree that I core, and then when I have cell service
again I could upload the information to the Survey123 software. Using the
analysis tab, I could determine basic trends in the tree-core data before I
move to more complex analyses. It would also be helpful to see the spatial
organization of the trees and the trends seen in the survey results.
Another application of Survey123 could be a study of the
walkability of cities. The researcher can take their phone or another device
into a city and ask community members in a city to complete the survey. Then
the data could be uploaded into a web app and shared with the community.
Through this sharing platform an urban planner could describe the issues with
walkability and point out the surveys that state the presence of issues. This would facilitate better communication between city officials and residents.
Overall, Survey123 is a powerful software program that expedites the process of
collecting and analyzing survey data.